No items found.
Blog
Trust Your Gut? No, Trust Data Driven Decisions

Riddhi Patel


Data driven decisions are choices made by analyzing real evidence — not gut feeling — to guide strategy, reduce risk, and improve outcomes.
Here's what you need to know at a glance:
Think about the last time your team made a big call based on experience and instinct. It felt right. But did you know for certain?
More than half of Americans admit they trust their gut over hard evidence — even when the data says otherwise. In business, that habit is expensive.
The good news: the shift away from intuition isn't about removing human judgment. It's about grounding it. When decisions are backed by evidence, they carry more confidence, more clarity, and far better outcomes.
Yet the challenge for research teams today is real. Collecting data is easier than ever. Making sense of it — fast enough to matter — is where most teams struggle. According to industry data, 80% of an analyst's time goes toward cleaning and organizing data, leaving just 20% for actual analysis.
That gap between raw data and actionable insight is exactly where tools like RevealAI's AI-powered qualitative research platform make a measurable difference — helping teams move from slow, manual synthesis to structured, verifiable insight at speed.
This guide walks you through everything: what data driven decision-making really means, how to implement it, and how to build the habits and systems that make it stick.
Simple guide to Data driven decisions terms:

At its core, Data driven decisions (DDDM) represent a shift in organizational philosophy. Instead of relying on the "Highest Paid Person's Opinion" (HiPPO) or historical anecdotes, we look at the numbers and the narratives provided by our users. This evidence-based analysis ensures that strategic business goals are not just aspirational but achievable.
The risks of relying solely on intuition are well-documented. Scientific research suggests that humans are prone to cognitive biases, such as confirmation bias, where we only seek out information that supports what we already believe. In a fast-moving market, these blind spots lead to missed opportunities and wasted capital.
By contrast, the benefits of implementing a data-driven framework are staggering:
For those in market research, this means moving beyond static reports to a dynamic understanding of the target audience.
In the past, qualitative research was a bottleneck. You could have speed or you could have depth, but rarely both. An S&P Global Market Intelligence Study found that while 96% of respondents highlight the importance of data utilization, many struggle with the manual labor required to extract meaning from it.
This is where an AI-powered qualitative research platform changes the game. By using automated qualitative analysis, we can now conduct conversational interviews at scale. Instead of waiting weeks for a transcript and another week for coding, real-time analytics provide insights almost instantly.
However, speed without "verifiable trust" is dangerous. Generic AI tools often suffer from "hallucinations"—making up facts or losing the specific nuance of a customer's voice. Our approach at Reveal AI emphasizes a "Walled Garden" model. This means the AI only analyzes the specific data provided in the research, ensuring that every insight is anchored in a real human response, not a web-based guess.
Technology is only half the battle; the other half is people. A Forbes report notes that 73.5% of respondents from data-leading companies assert that their decision-making processes consistently rely on data. To reach this level, an organization must prioritize:
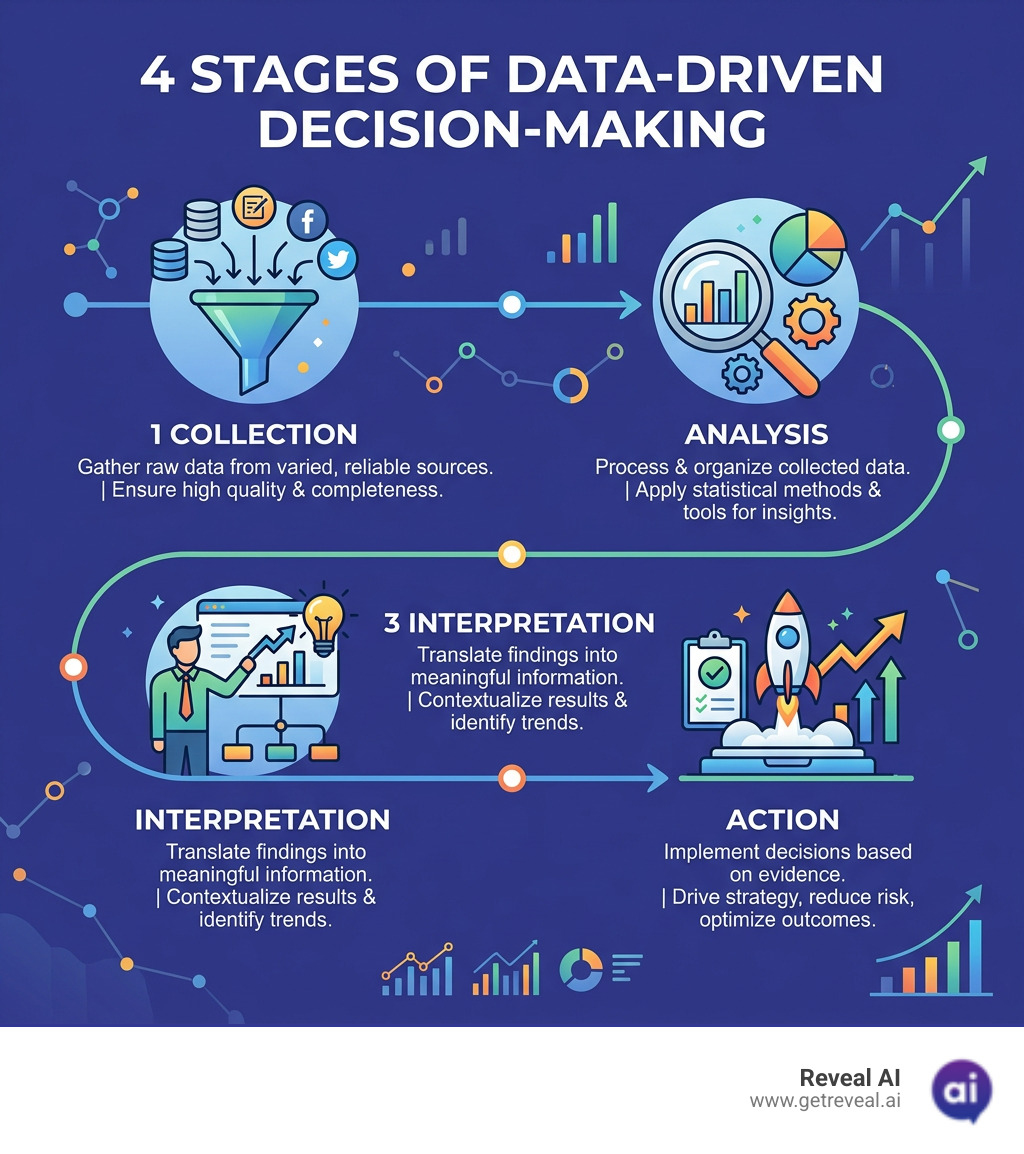
Implementing Data driven decisions requires a structured process. It starts with defining clear business objectives. Without a specific question—like "Why are users dropping off at the checkout page?"—data collection becomes a fishing expedition with no clear end.
One of the biggest hurdles is the "80/20 rule" of data science: 80% of the time is spent cleaning and organizing messy data, while only 20% is spent on analysis. To overcome this, modern researchers use different types of analytics to move from hindsight to foresight:
For deeper insights into how these analytics apply to specific groups, explore our guide on audience intelligence.
Not all data is created equal. To make effective Data driven decisions, you must identify which sources move the needle.
Interestingly, a Wavestone study found that between 2023 and 2024, the number of organizations that established a data and analytics culture doubled from 21% to 43%. This growth highlights the urgency of proper data governance and ethical usage. As we collect more personal information, maintaining privacy and security is not just a legal requirement—it’s a cornerstone of customer trust.
Data visualization is the bridge between raw numbers and human understanding. It allows us to spot patterns that would be invisible in a spreadsheet. While quantitative data tells us what is happening (the "how many"), qualitative data tells us why (the "how it feels").
FeatureQualitative ResearchQuantitative ResearchGoalUnderstand motivations and "why"Measure trends and "how many"Data TypeText, video, open-ended responsesNumbers, ratings, statisticsSample SizeSmall, focused groupsLarge, statistically significant groupsAnalysisThematic coding, sentiment analysisStatistical modeling, regressionsReveal AI RoleScales "why" using AI interviewsComplements "what" with context
Effective data storytelling uses interactive dashboards to align stakeholders. When a product manager can see a bar chart of feature requests alongside direct, anonymized quotes from users, the path forward becomes undeniable.
User research is often the first thing to be cut when timelines are tight. However, skipping generative or evaluative research is a recipe for product failure.
Google's famous "people analytics" initiatives, such as Project Oxygen, proved the value of this approach. By analyzing over 10,000 performance reviews, they identified the specific behaviors that made managers successful, leading to a 5% increase in manager favorability scores.
An AI research platform allows teams to replicate this level of rigor without the massive overhead. Automated participant recruitment and iterative testing mean you can run a research sprint in days rather than months. This allows UX and product teams to de-risk launches by getting feedback at every stage of the lifecycle.
The biggest threat to Data driven decisions is poor data integrity. "Garbage in, garbage out" remains the golden rule of analytics. Data silos—where marketing has one set of numbers and sales has another—create confusion and internal friction.
Furthermore, the rise of generic LLMs has introduced the risk of AI "hallucinations." If a researcher asks an AI to summarize 500 interviews and the AI fills in the gaps with its own training data, the resulting "insight" is a lie.
Reveal AI solves this through a "Walled Garden" data integrity model. Our platform provides:
For those interested in how this looks in practice, check out our customer research use cases.
The transition to Data driven decisions is no longer a luxury; it is a necessity for any organization that wants to remain relevant in a complex, fast-changing market. By 2026, 65% of B2B sales organizations are expected to have fully transitioned to data-driven models. Those who continue to "trust their gut" will find themselves outpaced by competitors who are moving with the speed and precision of evidence.
We've seen that the most successful companies don't just "have data"—they have a culture that respects it. They use AI not to replace human intuition, but to provide the guardrails and evidence that make human judgment more effective. By leveraging an AI-powered qualitative research platform, teams can finally bridge the gap between the scale of quantitative data and the deep, human nuance of qualitative insights.
Key takeaways to remember:
The future of research is not just about having the most data—it's about having the most trusted insights. When you stop guessing and start listening to the data, you don't just make better decisions; you build a better business.
Ready to see how AI-powered qualitative research can transform your decision-making? Explore our resources or learn more about how we help product teams gain an edge.