No items found.

Blog
From Verbatim to Victory: Mastering Open-Ended Survey Analysis

Riddhi Patel


Open ended survey analysis is the process of changing unstructured text responses from survey questions into structured, actionable insights that reveal the "why" behind respondent behavior and attitudes.
Quick Answer for Researchers:
What It IsConverting qualitative survey responses into themes, patterns, and strategic insightsWhy It MattersReveals motivations, emotions, and context that closed-ended questions missKey ChallengeScaling analysis while maintaining research rigor and verifiabilityModern SolutionResearch-grade AI platforms that provide speed and trust through attribution
"We added an open text box to our survey... but we couldn't tell what exactly was broken." This confession from a B2B SaaS product manager captures a common reality: open-ended questions hold immense potential, but extracting their value is frustratingly difficult.
The irony is stark. While 64% of researchers use text box questions for their deep insights, these responses often sit unanalyzed. Traditional manual analysis cannot scale, and generic AI tools introduce risks like hallucinations and unverifiable claims that erode client trust. Faced with pressure for faster insights on tighter budgets, researchers are at a crossroads. Many avoid open-ended questions, attempt manual coding that delays decisions, or use basic AI tools that damage their credibility.
There is a better path. Research-grade AI research platforms like RevealAI provide both the speed modern research demands and the attribution and verifiability that market research firms, UX and product research teams, and analysts require. By operating within a "Walled Garden" data integrity model—no web data, direct quote linkage, human verification options—RevealAI transforms open-ended analysis from a resource drain into a strategic advantage.
This guide shows you how to master open-ended survey analysis, from foundational techniques to AI-powered methods that maintain research integrity.
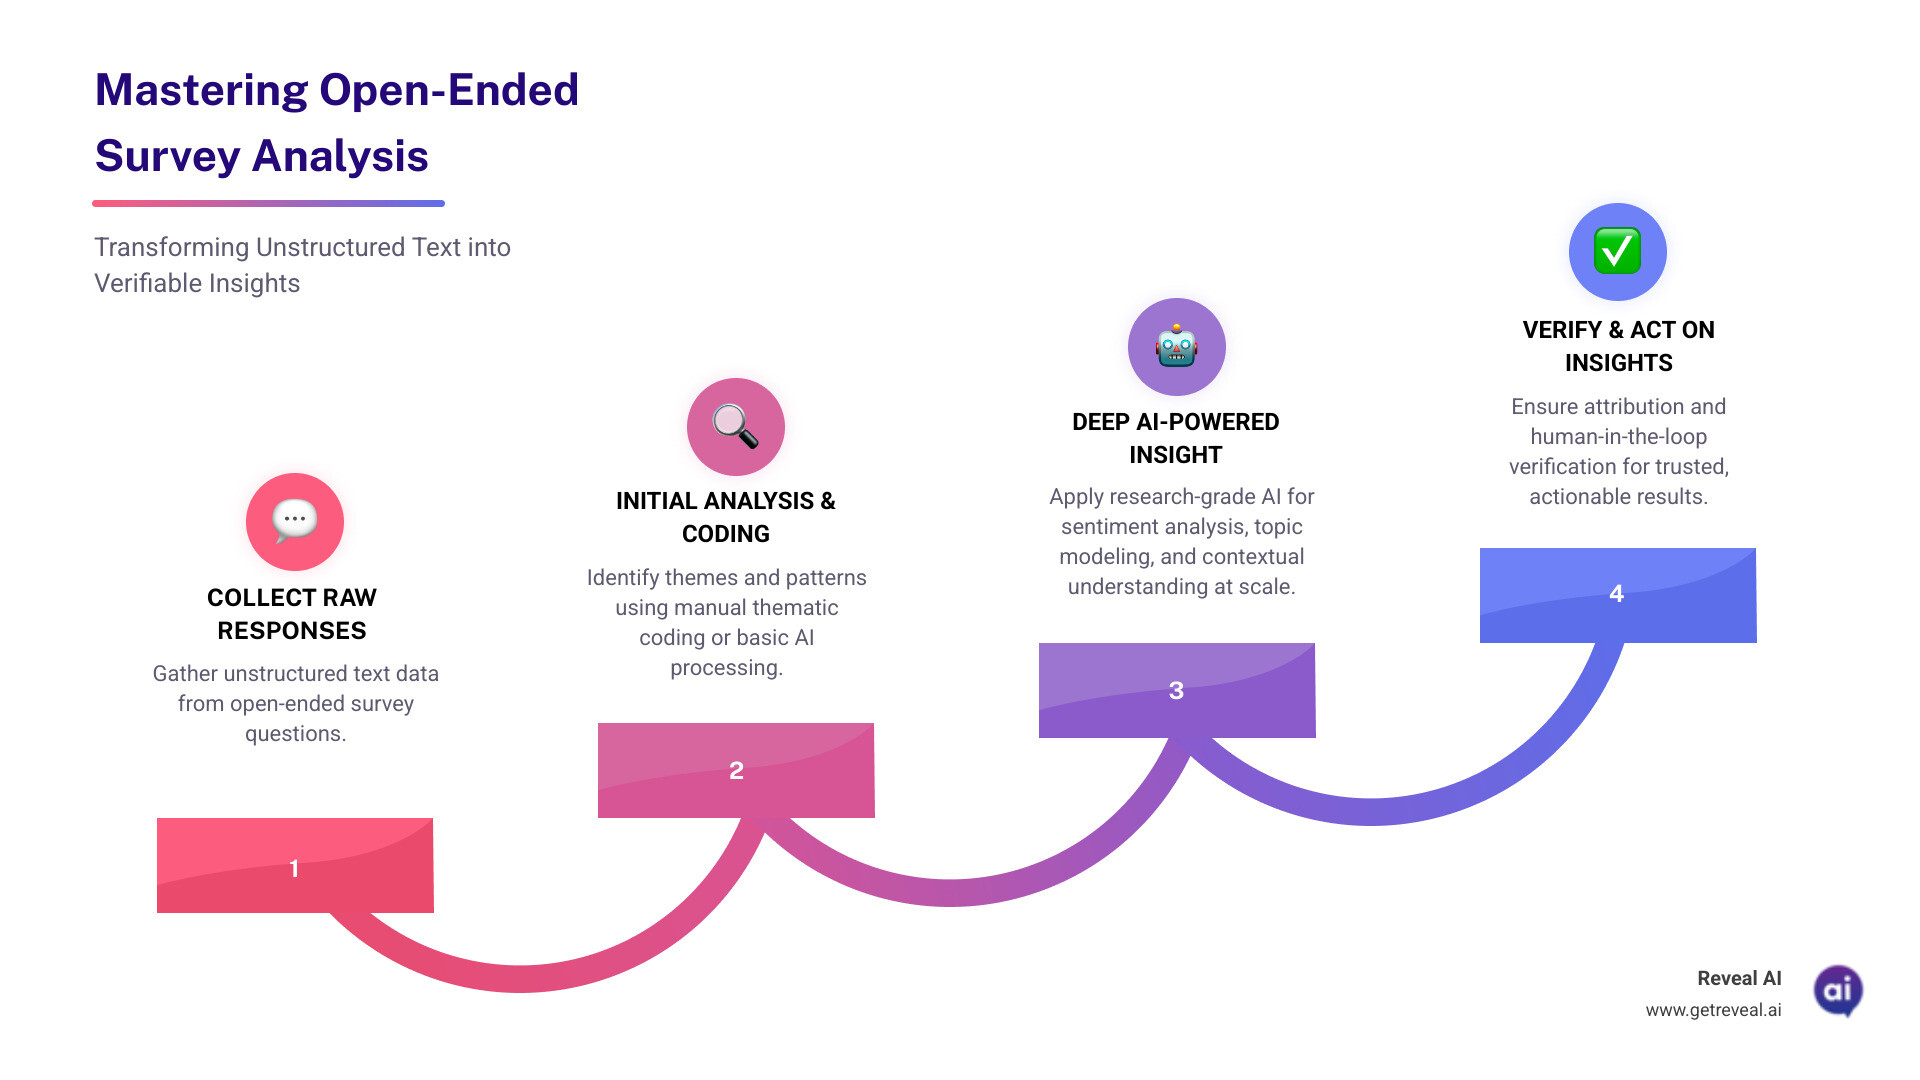
This section guides market research and product research teams through turning raw text into strategic insights, covering traditional methods and the new frontier of AI-powered analysis. We explore foundational techniques, their challenges, and how RevealAI’s research-grade AI research platform provides a trusted path to speed and depth.
Open-ended questions are invaluable for capturing the "why" behind quantitative data. They reveal motivations, emotions, and unexpected insights that closed-ended questions miss. For instance, they can explain why respondents are dissatisfied, revealing issues like "slow response times" or "missing integrations." This depth helps explain the high preference many respondents show for essay-style questions when given the option.
However, the challenge lies in the analysis. The data is unstructured, voluminous, and requires significant effort to categorize. A skilled analyst might take 20-30 hours to manually code just 1,000 responses, making it difficult to scale and often delivering insights too late to be actionable.
These two methods serve different purposes:
Often, thematic analysis is used to identify themes, and content analysis is then applied to quantify them.
Quality analysis depends on quality responses. For market research firms and product research teams, careful question design is non-negotiable:
Despite these careful efforts, the scale of modern data often makes traditional methods insufficient for today’s research timelines and stakeholder expectations.

While manual methods are insightful for small datasets, they struggle with the speed and scale modern research requires. This is where AI-powered qualitative research platforms like RevealAI change the landscape of open ended survey analysis.
Our AI research platform is designed to accelerate and deepen analysis, addressing the limits of manual coding.
Our focus is on market research firms, UX and product research teams, and analysts. RevealAI directly addresses the pressure for faster, cost-effective insights by improving both the speed and depth of qualitative analysis, while maintaining research-grade standards that generic AI tools do not prioritize.
In the rush for speed, many generic AI tools introduce risks like hallucinations, lack of attribution, and unverifiable insights. This can erode client trust and undermine your reputation as a research partner. At RevealAI, our philosophy is "Trust first, not novelty first." We are committed to ensuring the accuracy and reliability of our analysis.
We ensure the highest standards through several key differentiators:
By combining AI speed with data integrity, attribution, and human oversight, we empower research teams to deliver insights that are both fast and trustworthy.
Analyzing responses is only half the battle; communicating insights effectively is equally crucial. Data visualization can turn raw data into compelling narratives that stakeholders can act on.
While basic word clouds offer a quick glance at terms, they lack context, sentiment, and the "why." We advocate for visualizations that tell a comprehensive story. We use design principles to create clarity:
Our platform enables researchers to create sophisticated visualizations:
No visualization can replace the power of a direct quote. We integrate verbatim responses into reports to add authenticity and bring data to life. Quotes can be used to open a presentation, introduce a theme, or build authentic user personas.
For more on creative visualization, refer to "What to Do With All Those Open-Ended Responses? Data Visualization Techniques for Survey Researchers." By leveraging advanced visualization and direct quotes, we transform findings from open ended survey analysis into actionable stories.

Open-ended survey analysis is a critical component for any research team seeking to understand the "why" behind respondent behavior. The journey from raw text to actionable insight is complex, challenged by scale, subjectivity, and the need for verification.
While manual methods like thematic coding offer depth, they cannot scale to meet modern demands on market research firms, UX and product research teams, and analysts. AI-powered qualitative research platforms like RevealAI provide the necessary speed, consistency, and depth through advanced text analytics and scalable conversational AI interviews.
Crucially, speed must never come at the expense of trust. Our "Trust first, not novelty first" philosophy is embodied in RevealAI's Walled Garden data model, direct quote linkage, and human-in-the-loop verification. This ensures that insights are not only rapid but also accurate, verifiable, and attributable—a vital distinction for maintaining client confidence and protecting your reputation.
Finally, effective visualization bridges the gap between data and decision-making. By moving beyond superficial charts and using sophisticated techniques complemented by direct quotes, we craft compelling data stories that drive strategic action.
By adopting a 'trust first' approach with research-grade AI, market and product research teams can finally open up the full value of qualitative data without compromising on the integrity and verifiability that clients demand. This transforms open-ended analysis from a resource-draining task into a strategic advantage.
Ready to conduct market research without doubt?